EMBEDDED · SENSORS · BLE · PCB DESIGN
A plant sensor, from soil to screen
I wanted a plant monitor that I could build and understand from the copper in the soil to the numbers on a screen. The result is a custom sensor PCB, a separate solar power board in development, and an ESP32 bridge with two displays. The bridge now also sends hourly reports to this site; the first live upload has been received.
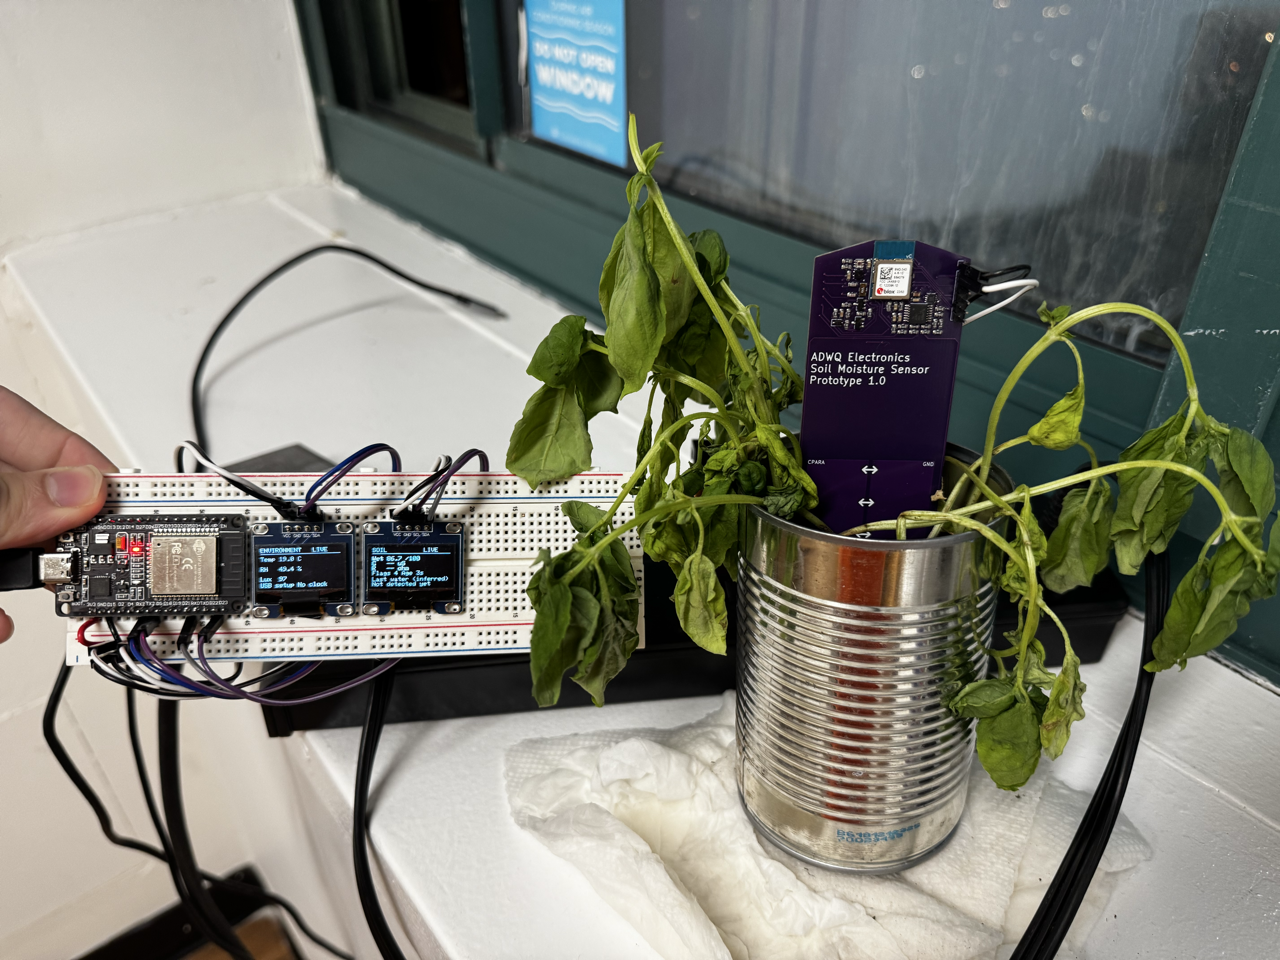
Two ways to look at the soil
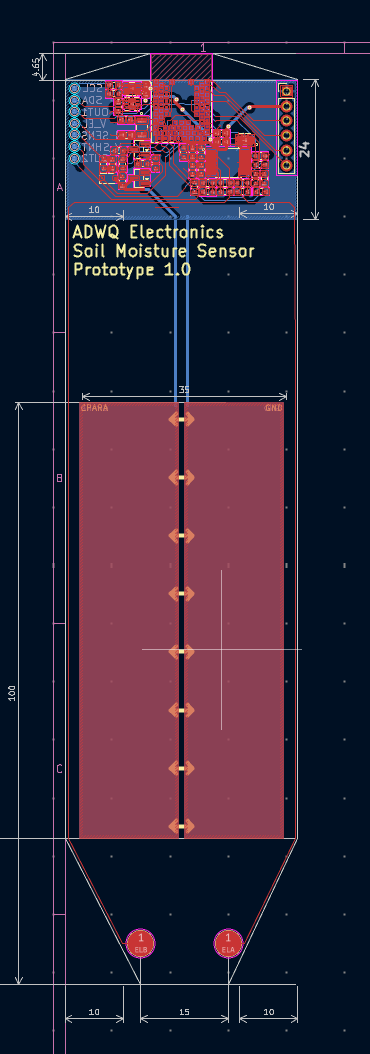
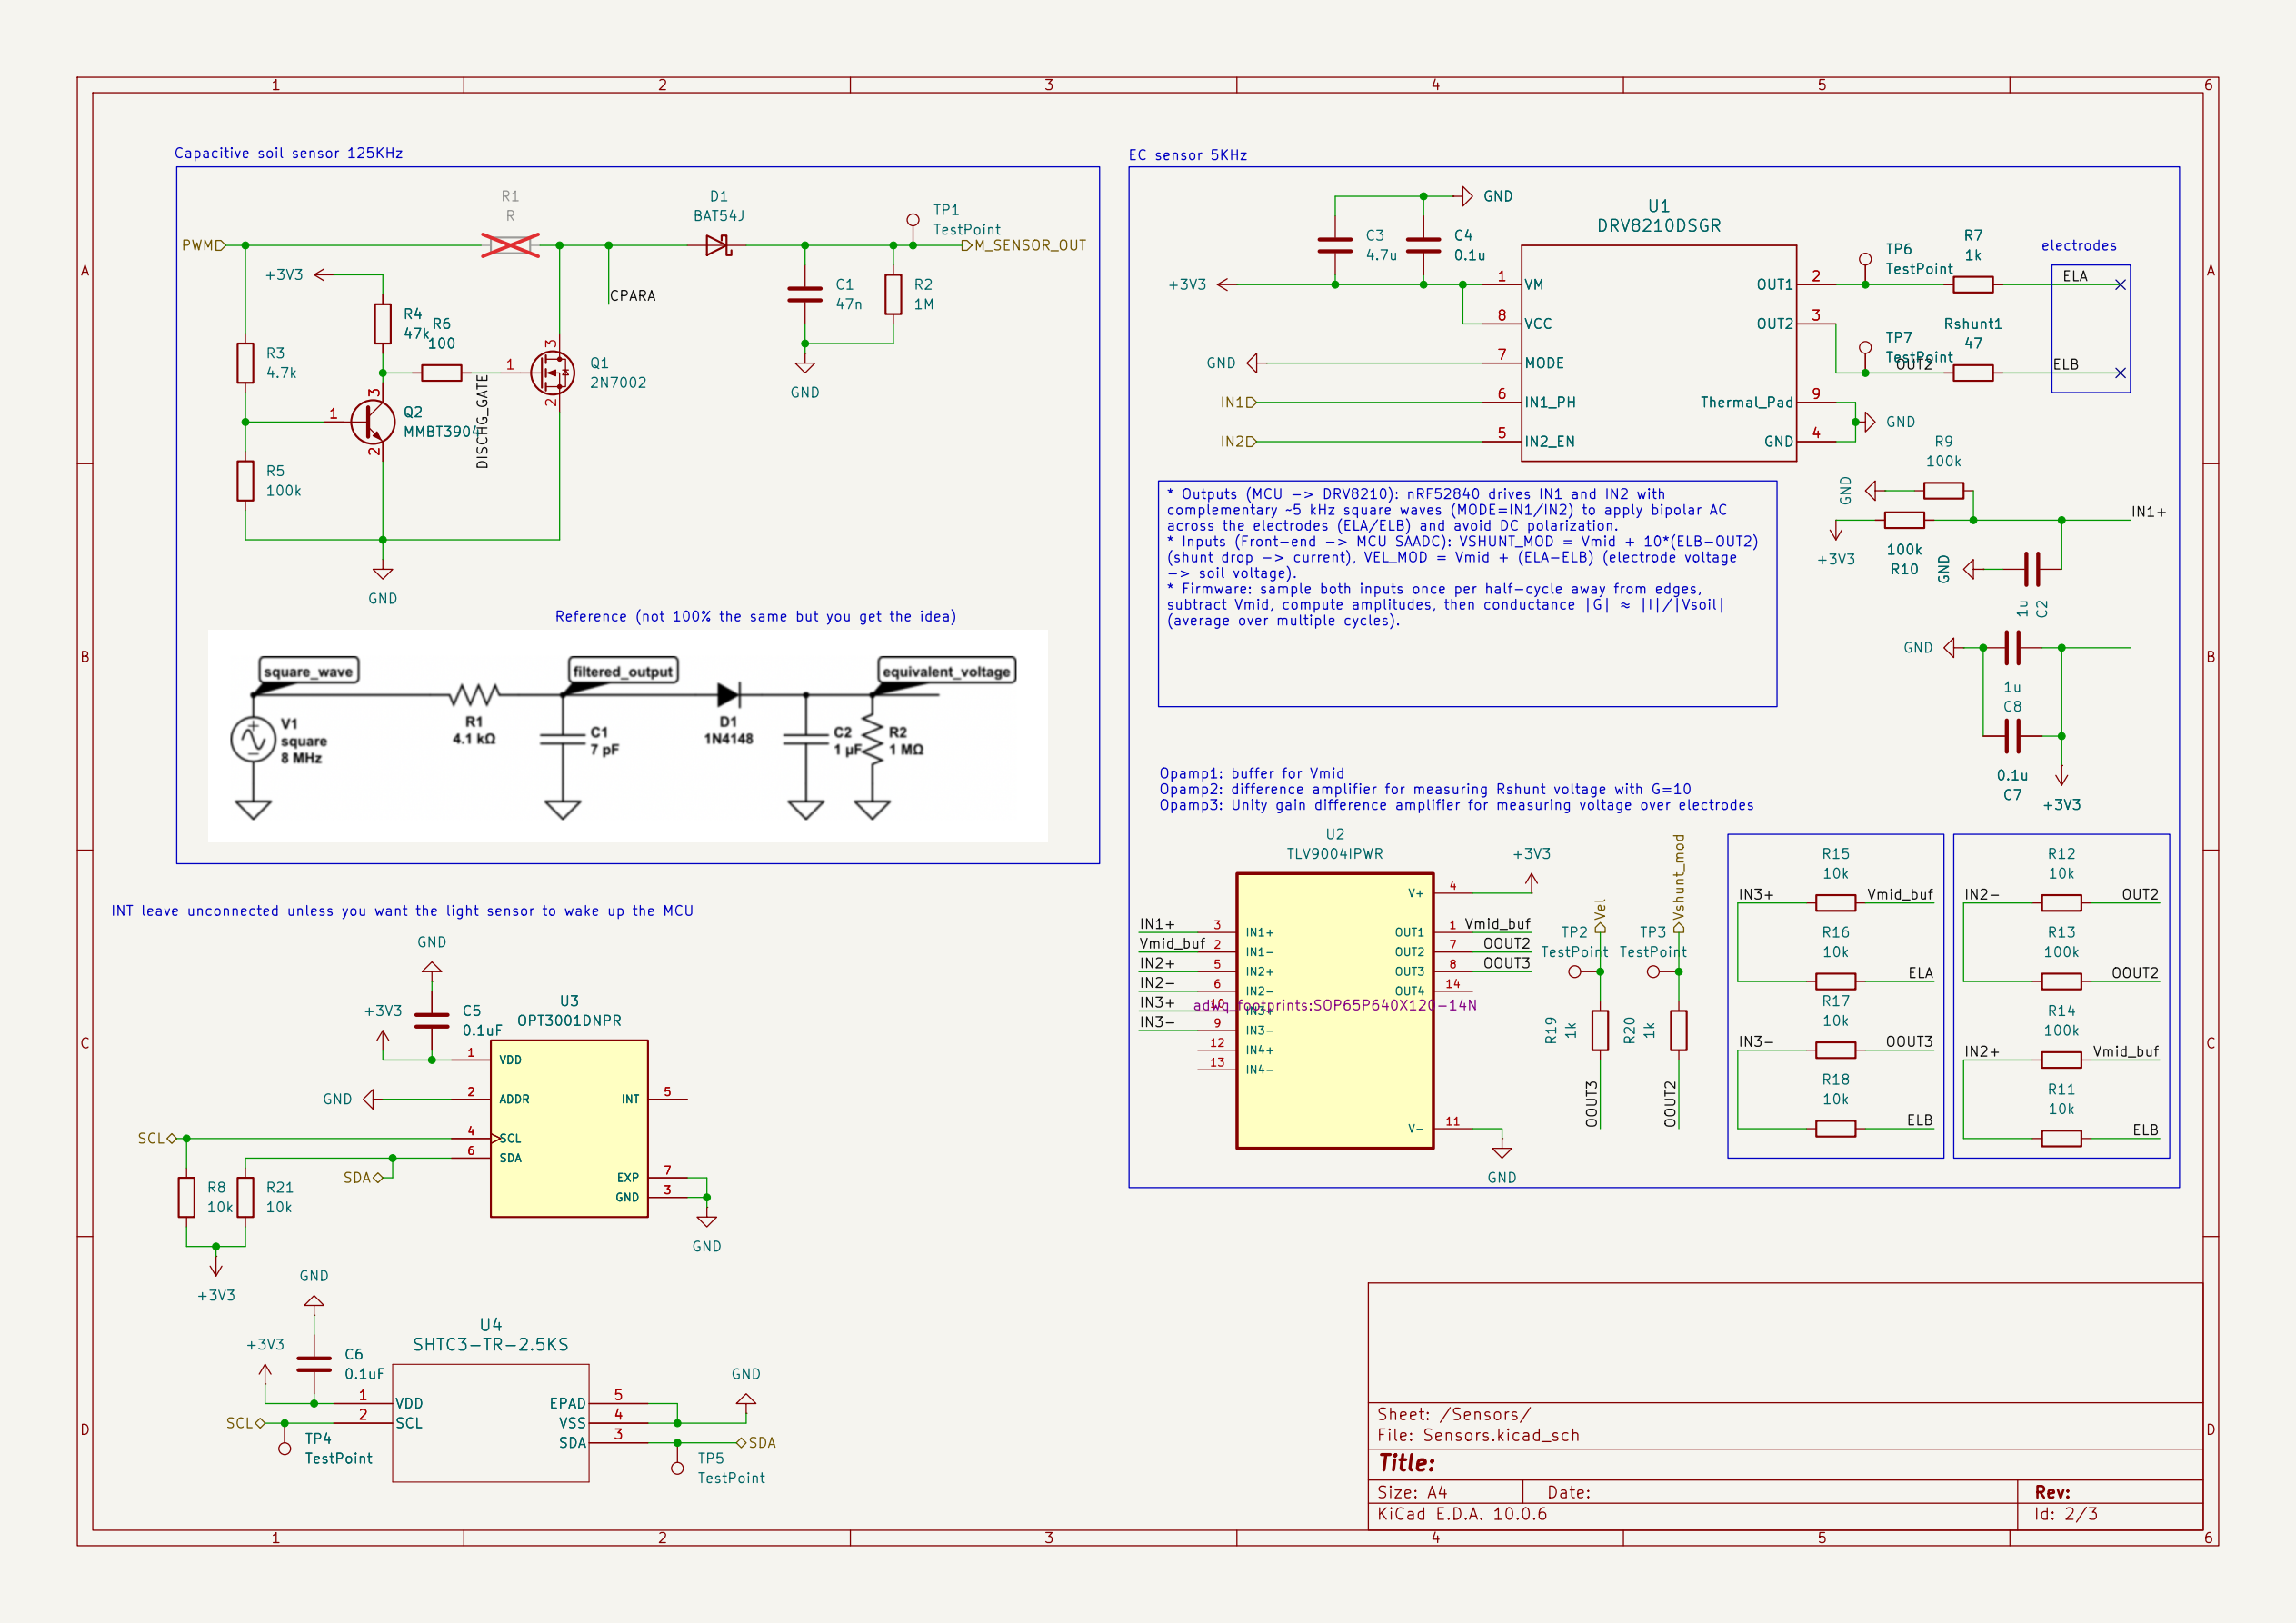
The long copper plates on the PCB form a capacitor with the material around them. The nRF52840 excites that probe at 125 kHz, and an analog circuit turns its response into a voltage the microcontroller can sample. In my reference tests, wetter conditions gave a lower voltage. Firmware maps that voltage through three calibration points to a relative wetness index. It is useful for following changes in this setup, but it is not a percentage of water in the soil.
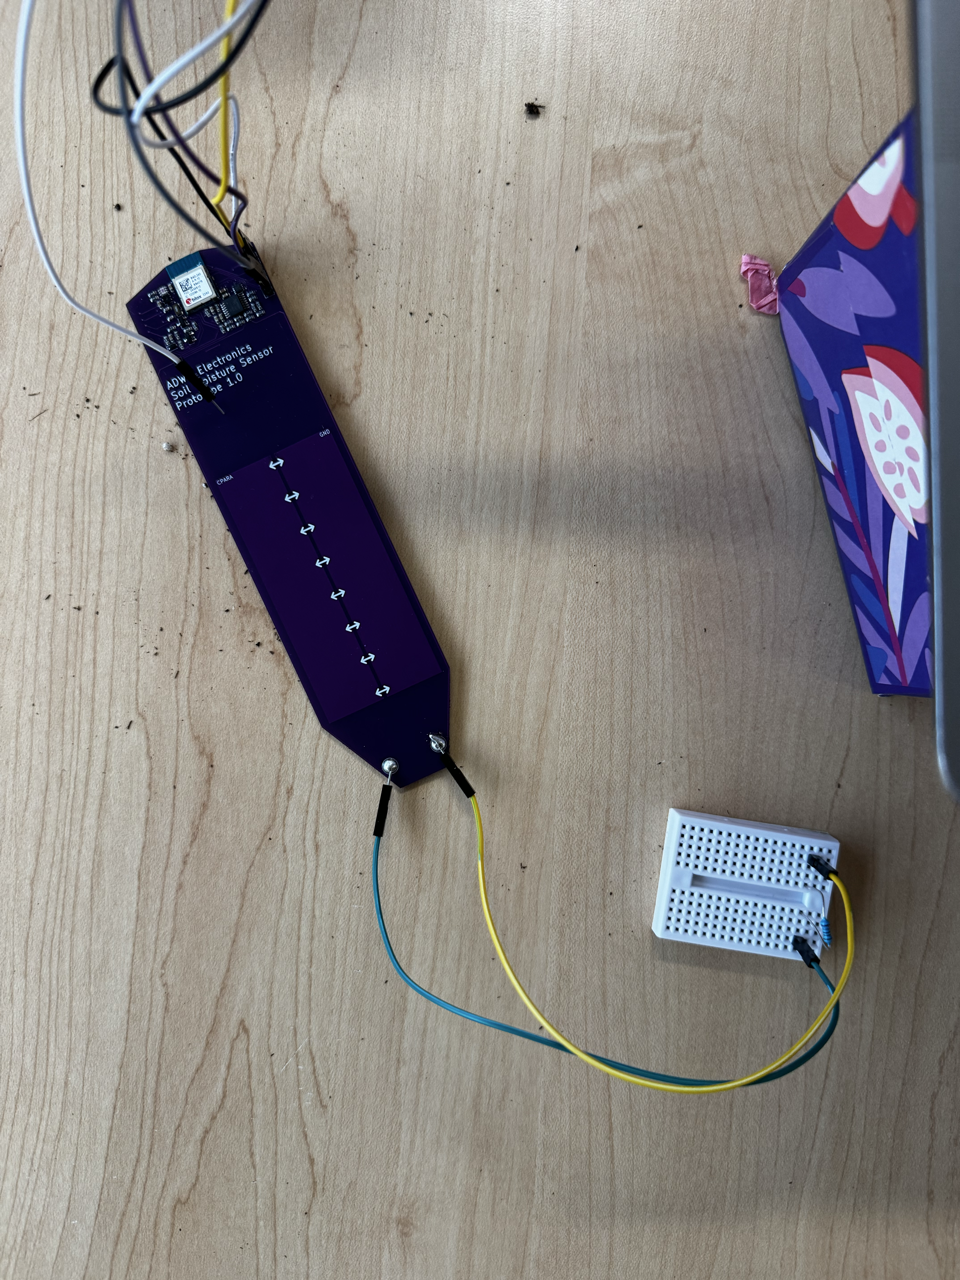
At the tip, two exposed electrodes make a second measurement. A DRV8210 H-bridge reverses their excitation at 5 kHz instead of holding a DC voltage across them. A TLV9004 circuit measures the electrode voltage and the current through a shunt. By sampling both polarities and comparing amplitudes, the firmware estimates resistance and conductance against known resistors. Turning that into soil conductivity would require electrode and temperature calibration.
The rest of the measurements
An SHTC3 reads local temperature and relative humidity over I²C. The firmware wakes it for a measurement, checks the CRC on the returned data, and puts it back to sleep. Its temperature is the sensor’s surroundings, not necessarily the temperature of the buried soil. An OPT3001 on the same bus takes single-shot ambient-light readings in lux. The microcontroller also measures its supply voltage for troubleshooting; that voltage is not a battery-charge estimate.
The controller is a BMD-340 module with a Nordic nRF52840. It lets the capacitive output settle before averaging readings and times the conductance samples around the 5 kHz switching waveform. If a sample crosses a switching edge, it is rejected and retried. Sensor communication failures, amplifier clipping, and results outside the calibration range get fault flags rather than silently becoming ordinary measurements.
From BLE to two displays and a website
The sensor sends structured readings over Bluetooth Low Energy. The bridge, built around an ESP32, asks for fresh data about every five seconds. One OLED shows temperature, humidity, and light; the other shows wetness, conductance, and watering status. The displays sit on separate I²C buses, which lets them use the same display address.
The bridge also watches for a possible watering event: a sustained rise in the wetness index together with a fall in raw capacitive voltage. That is an inference from the electrical response, not a confirmed watering log. It marks old readings as stale, reconnects after BLE loss, and collects hourly summaries. Each completed report can include wetness mean, minimum, and maximum, the latest full sensor reading, sample counts, freshness, and watering state.
For the web connection, the ESP32 initiates an HTTPS upload with certificate verification. A server endpoint checks the report and saves it before acknowledging it; a report ID makes retries safe. A partial test report has made that full trip to the site. The 24-hour field note plots saved reports as they arrive. Because a report closes every 3,600 seconds of bridge uptime, gaps in the plot are possible when power or connectivity is interrupted.
Power and the unfinished parts
A separate board uses a BQ25570 to harvest solar energy, manage storage, and regulate power for the sensor. That part remains on the bench. Validation so far has used an external supply, and the harvester’s voltage settings and panel match still need work. I have not measured battery life.
The capacitive response, environmental sensors, BLE link, displays, report persistence, and a website upload have been demonstrated. The conductance path behaves with reference resistors but clips in the moist soil I tested. The wetness calibration is provisional, and the watering detector still needs a real watering test. That is the next useful step: collect enough trustworthy history to compare the sensor’s claims with what actually happened to the plant.