FIELD NOTE · LIVE SENSOR DATA
24 hours in the soil
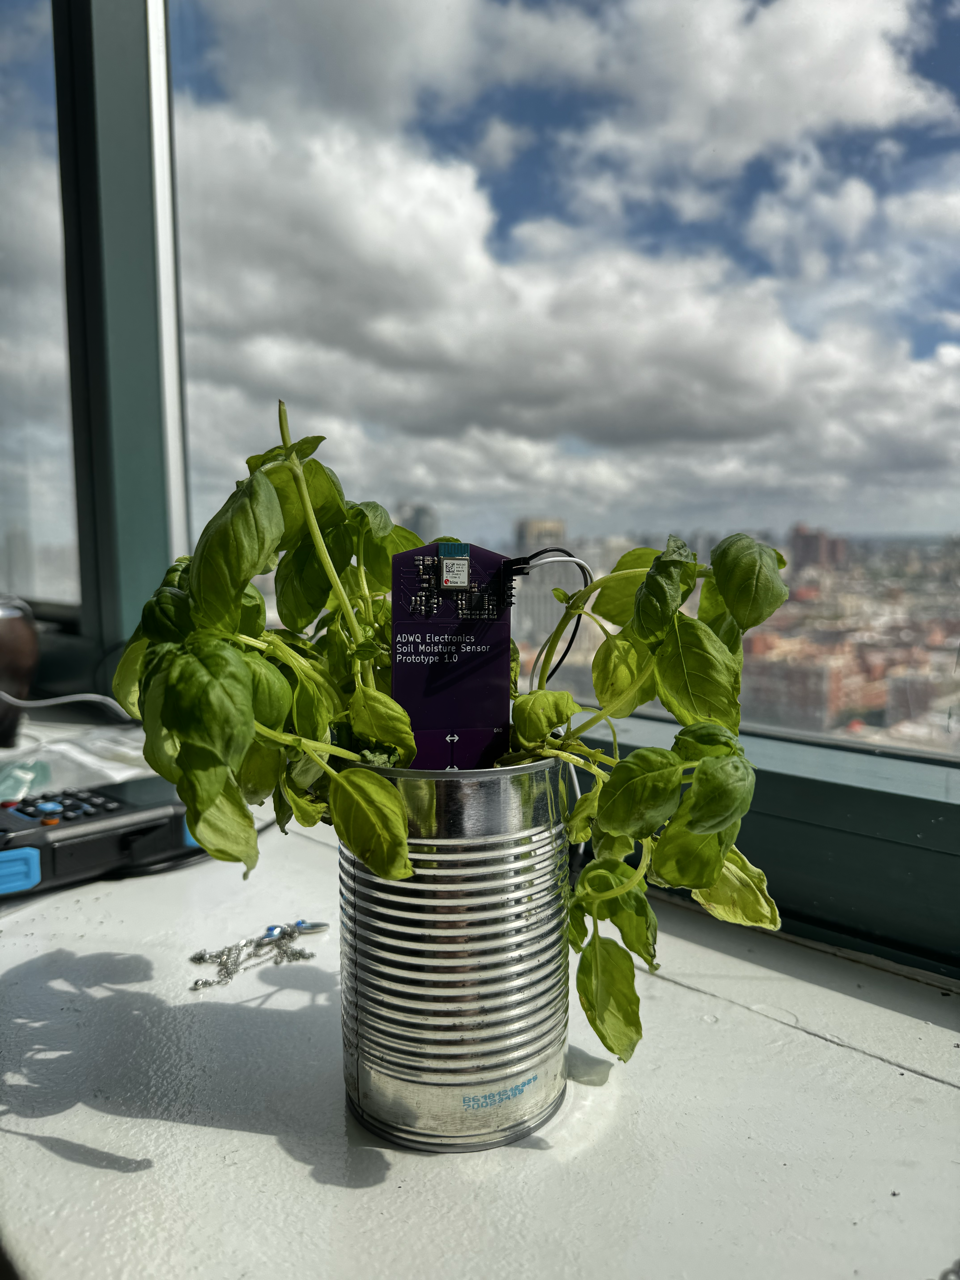
A running look at what my basil plant’s sensor has reported to the site. The bridge saves one summary every 3,600 seconds of uptime, so this plot will grow as it stays powered and connected.
The last day of readings
Each wetness point is the mean relative index for one saved report window. The other views use the report’s latest reading. Missing hours are left blank; they do not mean the soil was dry.
What the numbers mean
The wetness index comes from three reference points on this particular capacitive probe. It is not a soil-water percentage, and a change is more useful than the absolute value. The conductance reading measures the electrical path between the exposed electrodes; it is not a calibrated soil conductivity value. Temperature and humidity are measured near the sensor electronics, while light is ambient illuminance.
The bridge can flag a possible watering event from a sustained increase in wetness and drop in the raw probe voltage. That detector has not yet been validated with a real watering event. Reports with no reliable reading may leave a metric blank, and the first test upload covered only a partial window.